TYPES OF RESULTS

We offer you a broad portfolio of processing and presentation options for your study results.
Whether for internal purposes or external communication, our experts will be happy to advise you on which type of result is best suited to your project.

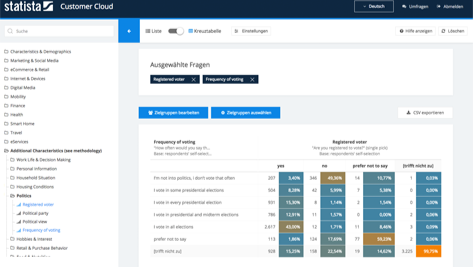
Statista Customer Cloud®

With the Statista Customer Cloud®, our interactive cloud-based DIY evaluation tool, you have the opportunity to carry out your own, individual analyses of your study results. You can quickly and easily create your own data evaluations online with just one click to identify trends and changes.

The tool also offers the possibility to easily carry out re-contact and tracking studies based on a large-scale initial survey with further ad-hoc surveys of the same target groups in order to evaluate relevant questions with individual target groups – in your own panel.

  • All your studies in one, cloud-based place
  • Monitor trends and changes over time
  • Re-contact and tracking studies with access to your target groups

With the Statista Customer Cloud®, our interactive cloud-based DIY evaluation tool, you have the opportunity to carry out your own, individual analyses of your study results. You can quickly and easily create your own data evaluations online with just one click to identify trends and changes.

The tool also offers the possibility to easily carry out re-contact and tracking studies based on a large-scale initial survey with further ad-hoc surveys of the same target groups in order to evaluate relevant questions with individual target groups – in your own panel.
  • All your studies in one, cloud-based place
  • Monitor trends and changes over time
  • Re-contact and tracking studies with access to your target groups
Interactive Dashboard

For agile and efficient market research, we offer you – together with our partner Quantilope – an attractive dashboard solution in which your study results can be clearly visualized and followed live at a glance.

The dashboard solution is particularly suitable for getting a quick overview of relevant KPIs, whether for your products, target groups or your brand.

  • Interactive live dashboard tailored to your needs
  • Fast, uncomplicated visualization of study results
  • All relevant KPIs at a glance, also in wave comparison
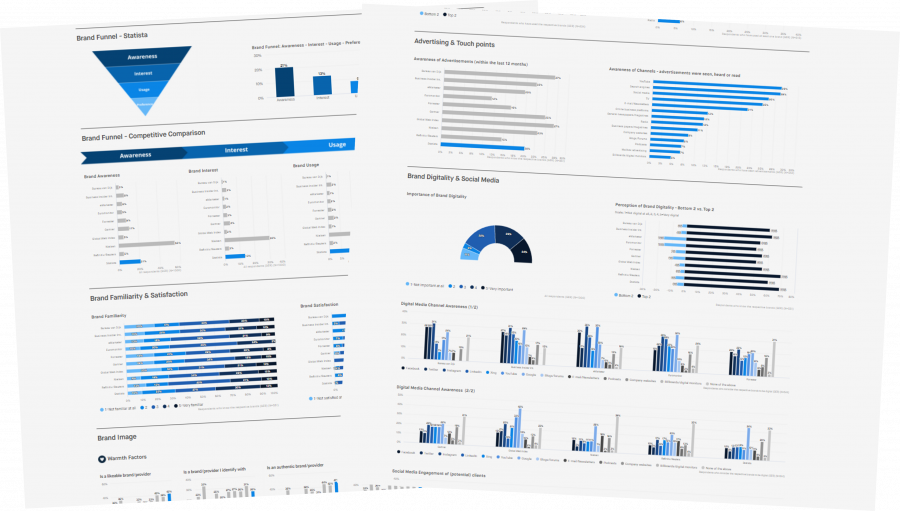
Management Report

For the presentation of the core results and insights of your study, we create a management report for you, e.g. in PowerPoint, Google Presentation, or Google Slides, and gladly in your own corporate design.

In your report we prepare the central results graphically and work out the insights and concrete recommendations for action for you based on the data.

  • Visualization of the results in your design - instantly ready for internal or external communication
  • Summary of all relevant findings
  • Derivation of insights and recommendations for action
Tables

For the detailed presentation of your study results you will receive an extensive, structured and professionally prepared set of tables in Excel as standard.

In addition to the overall results for all the questions examined, the table volume also contains your individually desired subgroups, e.g. according to age, gender, region or specific characteristics.

  • Overview of all results in one document
  • Quick availability of the results in detail
  • Subgroups and evaluation tailored to your needs
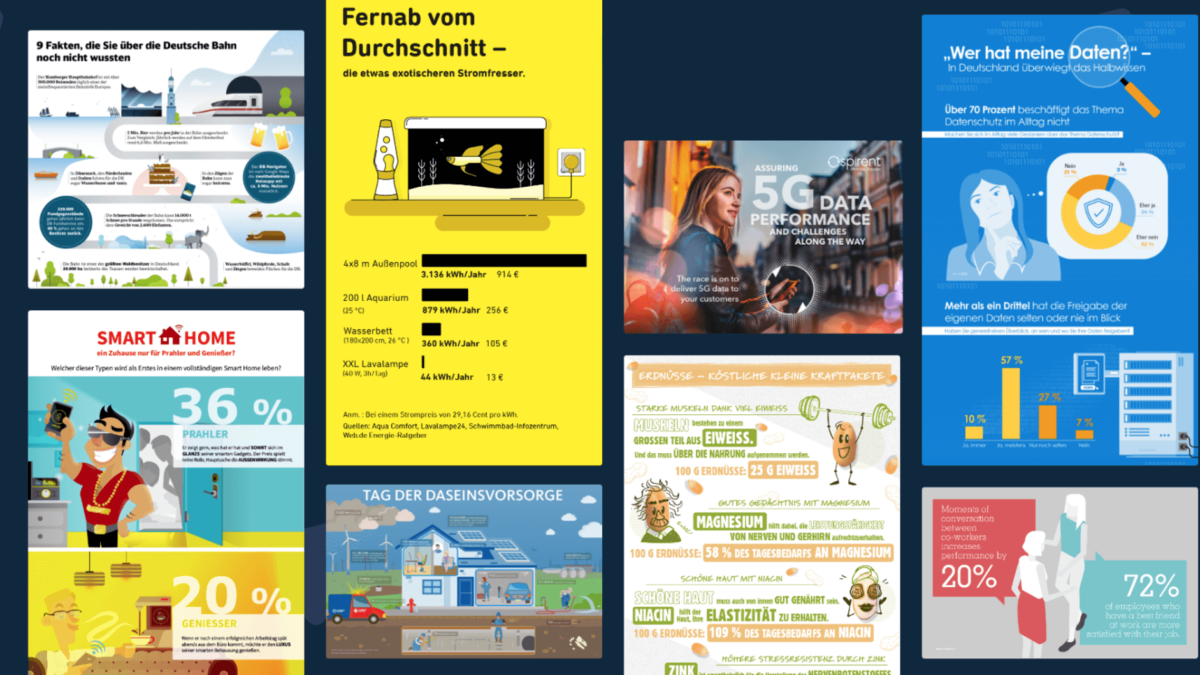
Infographics, Videos, & Co.

With Statista Content & Design we have an
in-house agency for marketing and information design, wih experts on how to present your study results in a visually compelling way.

Let your study results be easily comprehensible with professional design, e.g. in the form of infographics, whitepapers, brochures, ePapers, videos, microsites, interactive websites and much more.

  • Data collection, evaluation & graphical processing from one source
  • Visualizations for marketing and PR purposes in your design
  • The perfect format for your purpose, such as infographics, videos or story charts